How to Create an Access Analysis Report: Structure That Gets Read and How to Summarize Key Metrics
Published:
Last Updated:
Category: Web Analytics
Authors:
Published:
Last Updated:
Category: Web Analytics
Authors:
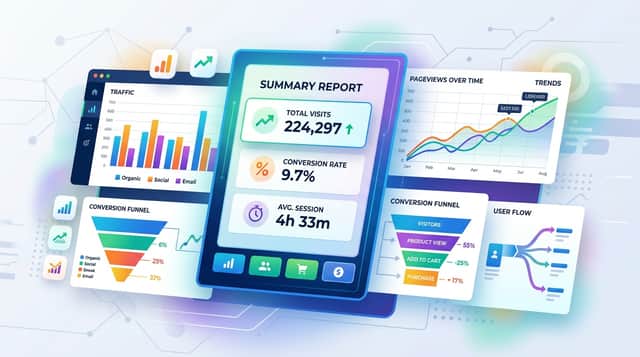
When you try to create an access analysis report, you often get stuck on "which metrics should I include" and "in what order should I arrange them so they get across." A report that merely lists numbers conveys neither the problems nor the actions to the reader. This article organizes the structure of an access analysis report that gets read (i.e., where the reader can understand the problems and the next actions) and how to summarize the main metrics, on the premise of GA4. Rather than tool operation steps, it focuses on the report's "template" and "how to choose metrics."
Before you start building, decide who the report is for and what it is meant to help judge. If this is vague, the metrics balloon and the report's key points become blurred. The basic approach is to change the level of detail you include according to the reader: for executives, weight the summary of results (conversions) and month-over-month figures heavily; for the front line, detail the behavioral data and the pages to improve.
The goal of a report is not "to report numbers" but "to be able to decide what to do next." Simply holding this perspective makes it easier to judge which metrics to include and which not to.
Access analysis reports used in practice are typically built from the following four blocks. Structuring them so you can follow the numbers in the flow of "acquisition to behavior to results" makes it easier to pinpoint where the problems on the site are.
These four blocks follow, from top to bottom, the user's flow of "people arrive, act within the site, and reach a result." For example, if acquisition is increasing but results are not growing, you can naturally read the data by looking for causes in the behavioral data (frequently viewed pages and exit points).
In GA4, the main KPIs are predefined, and you can grasp the basic metrics in the standard reports. The following are representative metrics to include in a report. You do not need to include all of them; select according to your purpose.
Note that GA4 defines metrics differently from UA (Universal Analytics). If you build a report with the metric sensibilities of the UA era, you cannot correctly evaluate the actual situation, so it is important to choose metrics in line with GA4's definitions—for example, using engagement rate rather than bounce rate.
Even with the same metrics, how easily they get across changes greatly depending on how you present them. Keep in mind the following to avoid simply lining up numbers.
The final piece that makes an access analysis report "something that works for the business" is the next action. Do not stop at merely lining up the overall summary, acquisition, behavior, and results data; present, as a set, a proposal for "what part of the site to improve and how next month, based on these results."
For example, if inflow from a particular landing page is high but the conversion rate is low, you translate the numbers into an action such as "make improving that landing page a priority measure for next month." Only when you dig in this far does the report become one on which the reader can make decisions.
An access analysis report that gets read is built from the four blocks of "acquisition to behavior to results," and the basic approach is to narrow down GA4's main metrics according to your purpose when summarizing. Show metrics as comparisons rather than single months, pair absolute numbers with rates, and use segments to pinpoint where the problems are. And finally, present the next action that translates numbers into measures. If you master this template, you will have a report that functions in practice—one on which the reader can decide the next move. For specific creation steps, please also refer to the article explaining report creation tools.
Find more of our articles on Google

A guide to using GA4 Explorations (data exploration), following its difference from standard reports, the main technique...

A guide to GA4 permission settings—the two levels of account and property, the differences between the Administrator, Ed...

A screen-by-screen guide to reading GA4 standard reports: the snapshot, realtime, the life-cycle reports (acquisition, e...