The Complete Guide to Marketing KPI Design | KPI Lists and Setup Process by Department and Initiative
Published:
Last Updated:
Published:
Last Updated:

Category: Marketing Budget & KPI
Authors: Shusaku Yosa
"I don't know how to design KPIs for our marketing initiatives." "Each initiative tracks different metrics, making it hard to see results at the organizational level." These are challenges many marketers face. Marketing KPIs serve as the bridge connecting business objectives (KGIs) to marketing activities. When designed correctly, they enable the entire team to push initiatives in the same direction and improve the accuracy of investment decisions. This article provides a systematic guide covering the fundamentals of marketing KPI thinking, KPI lists by department and initiative, and practical setup procedures you can use immediately.
A KPI (Key Performance Indicator) is a quantitative metric set to measure the degree of goal achievement. Marketing KPIs are the critical performance indicators established to measure and evaluate the outcomes of marketing activities. For example, specific numerical targets like "500 leads per month" or "CPA under 8,000 yen via advertising" are marketing KPIs.
Without properly designed marketing KPIs, team members end up chasing different metrics, making it impossible to prioritize initiatives. Conversely, when appropriate KPIs are reverse-engineered from business objectives, marketing activities gain clear direction, and PDCA cycle accuracy improves dramatically.
Before designing marketing KPIs, it is essential to understand the relationship between KGI (Key Goal Indicator), KSF (Key Success Factor), and KPI. A KGI quantifies the ultimate business objective—for example, "10 billion yen in annual revenue" or "1,000 new customer acquisitions." KSFs are the critical success factors for achieving the KGI, such as "diversifying lead acquisition channels" or "improving opportunity conversion rates." KPIs are the quantitative metrics tracked daily to realize these KSFs.
The fundamental approach is a top-down design: derive KSFs from the KGI, then translate KSFs into KPIs. If you set KPIs without following this order, you'll likely encounter the situation where "metrics are improving but business results aren't materializing."
Here we break down the practical marketing KPI design process into five actionable steps.
The starting point for marketing KPIs is always the business KGI. Align with leadership on revenue targets, profit targets, new customer acquisition numbers, MRR (Monthly Recurring Revenue), and other KGIs suited to your company's business phase. At this stage, it's also important to clarify the scope of marketing's contribution. For example, if marketing is responsible for generating 600 million yen in pipeline out of a 1 billion yen revenue target, that 600 million becomes marketing's KGI.
Next, define each stage of the marketing funnel and identify the points with the greatest impact on KGI achievement (KSFs). A typical B2B marketing funnel follows: Awareness → Lead Generation → MQL (Marketing Qualified Lead) → SQL (Sales Qualified Lead) → Opportunity → Closed-Won. For B2C, the funnel is: Awareness → Site Visit → Registration → First Purchase → Repeat Purchase → LTV Maximization. Analyze conversion rates at each stage—the bottleneck stages become KSF candidates.
Once the KGI and KSFs are determined, create a KPI tree. A KPI tree is a hierarchical diagram that places the KGI at the top and decomposes it into constituent KPIs. For example, the KGI "600 million yen in marketing-sourced closed revenue" decomposes into: Revenue = Opportunities × Win Rate × Average Deal Size. Further: Opportunities = MQLs × Opportunity Conversion Rate, MQLs = Leads × MQL Conversion Rate, Leads = Site Visits × CVR. A KPI tree visually reveals which metrics will have the greatest impact on the KGI when improved.
Set specific numerical targets for each metric in the KPI tree. There are three approaches: historical performance-based (using the past 6–12 months as a baseline with improvement factors), benchmark-based (referencing industry averages and competitor data), and KGI reverse-calculation (working backward from the KGI to determine required numbers). In practice, combining KGI reverse-calculation to establish required levels with historical performance to verify feasibility is most effective. Targets that are unrealistically high demotivate teams, while targets set too low slow growth—find the stretch-but-achievable sweet spot.
Setting KPIs is meaningless without regular monitoring. Build dashboards and establish systems to visualize KPI progress in real time or on daily and weekly cadences. The ideal is an environment that integrates data sources—GA4, ad platforms, MA tools, CRM—to manage the entire funnel centrally. Embed a routine of sharing KPI progress in weekly team meetings and deciding improvement actions on the spot when gaps appear.
Below is a comprehensive breakdown of KPIs for each major marketing initiative. Pick the ones relevant to your initiative mix.
The ten key KPIs for SEO and content marketing are: organic search traffic, keyword rankings (average position for target keywords), click-through rate (CTR), time on page, bounce rate, referring domain count, content-attributed lead count, content CVR, indexed page count, and domain authority. Short-term, track content publication count and indexed pages; mid-to-long-term, track organic traffic and content-attributed leads. Since SEO takes 3–6 months to show results, manage leading indicators (publication count, indexed pages) and lagging indicators (traffic, leads) separately.
The ten key PPC KPIs are: impressions, clicks, click-through rate (CTR), cost per click (CPC), conversions, conversion rate (CVR), cost per acquisition (CPA), return on ad spend (ROAS), impression share, and quality score. During the initial ramp-up, verify delivery volume and quality via impression share and CTR; in the stable operation phase, optimize cost efficiency around CPA and ROAS. Quality score improvement lowers CPC, indirectly boosting overall ROI.
Display and social ads primarily serve awareness objectives, so awareness-focused metrics dominate. The eight key KPIs are: impressions, reach (unique users), frequency (average exposures per user), CPM (cost per 1,000 impressions), CTR, video view rate (for video ads), view-through conversions (users who saw the ad but converted later without clicking), and brand lift (change in brand awareness and favorability before and after ad exposure). Evaluating awareness campaigns solely on direct conversions leads to undervaluation—combine view-through conversions and brand lift studies for a holistic assessment.
For organic social media, track these eight metrics: follower count (growth rate), post reach, engagement rate (total likes/comments/shares ÷ reach), profile clicks, link clicks, UGC (user-generated content) count, mentions, and social-attributed site traffic. Tracking only follower count is a classic mistake—manage engagement rate alongside social-attributed traffic and conversions. Each platform's algorithm differs, so KPI design must be tailored to each network's characteristics.
The ten key KPIs for email marketing and MA are: send volume, open rate, click-through rate (CTR), click-to-open rate (CTOR), unsubscribe rate, bounce rate, email-attributed conversions, lead scoring accuracy (opportunity conversion rate of top-scored leads), nurturing-attributed opportunities created, and nurturing cycle time (average days from lead acquisition to opportunity creation). Open rate measures subject line and timing quality; CTOR measures content quality—each serves a distinct role. For overall nurturing effectiveness, opportunities created and cycle time are the KPIs most directly tied to the KGI.
The ten key KPIs for webinars, events, and trade shows are: registrations, attendance rate (actual attendees vs. registrations), attendee satisfaction (survey score), new leads acquired, business cards exchanged (trade shows), post-event follow-up rate, event-sourced opportunities, event-sourced revenue, cost per lead, and event ROI. For webinars, a 50–60% attendance rate is typical—if low, improve reminder emails or revisit the content theme. Post-event follow-up rate and opportunities created are the most critical KPIs since they directly determine event investment payback.
The eight key KPIs for landing page and conversion rate optimization (CRO) are: conversion rate (CVR), form reach rate, form completion rate (EFO metric), scroll depth (read-through rate), exit rate, page load speed (Core Web Vitals), A/B test win rate, and CTA click rate. CVR improvement increases results without additional ad spend, creating significant impact on overall marketing ROI. The gap between form reach rate and completion rate (form abandonment rate) is often a high-opportunity area, making it a crucial metric for prioritizing form optimization efforts.
PR and communications KPI design has the inherent challenge of quantifying outcomes. The eight key KPIs are: media placements, media quality (Tier 1/Tier 2/Tier 3 classification), estimated article reach (advertising equivalent value), press releases distributed, journalist contacts, branded search volume trends, SOV (Share of Voice: your media exposure share vs. competitors), and crisis management incidents. Since PR contributes to brand awareness and trust-building rather than direct lead generation or conversions, using branded search volume trends and SOV as KPIs makes its indirect business contribution visible.
Depending on your marketing organization's size and structure, each department (team) will need to track different KPIs. Here we cover the key considerations for representative departments.
The demand generation team's top KPIs are MQL count and cost per MQL. Additionally, track lead count by channel, lead quality (MQL conversion rate), and pipeline contribution (total deal value of marketing-sourced opportunities). Chasing lead volume alone drives down MQL conversion rates and strains sales alignment, so balanced volume-and-quality KPI design is essential.
The content marketing team's core KPIs are content publication count (leading indicator), organic search traffic, and content-attributed leads (lagging indicator). Additionally, tracking keyword portfolio (number of keywords ranking in the top 10) and content repurpose rate (webinars, social posts, white papers, etc. derived from a single piece of content) maximizes content investment efficiency. Since content accumulates as an asset, evaluate not just single-month performance but also cumulative impact.
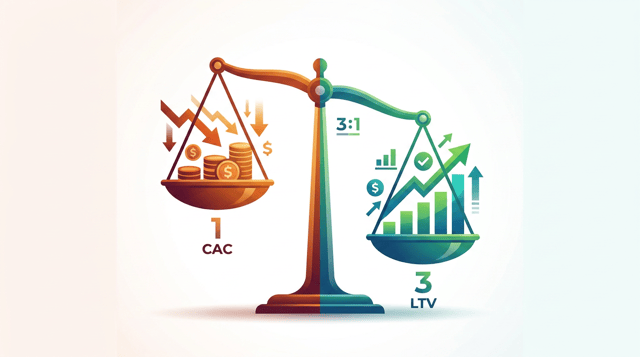
The paid media team centers its KPIs on CPA and ROAS. Additionally, track monthly ad-attributed lead count, CPA by channel, and MQL conversion rate of ad-attributed leads. To maximize ad spend efficiency, also manage CPC trends and quality score improvement as operational KPIs. While paid media teams face pressure for short-term results, setting CPA targets that account for LTV (customer lifetime value) enables focus on acquiring high-value customers over the long term.
The MOps team supports overall marketing organization productivity and efficiency. Key KPIs include data quality score (CRM duplicate rate, missing data rate, inaccurate data percentage), martech stack utilization rate, campaign launch lead time, reporting automation rate, and full-funnel conversion rate improvement. Since MOps KPIs inherently support other teams' KPI achievement, the ideal design demonstrates causal links—showing how your team's KPI improvements impacted the organization's broader metrics.
Marketing KPI design has its pitfalls. Here are common failure patterns and their countermeasures.
Setting every metric as a KPI fragments team attention, resulting in no meaningful improvement on any front. The fix: define one North Star Metric, supported by 2–3 sub-KPIs. Manage remaining metrics as monitoring indicators that only draw attention when anomalies occur.
Vanity metrics are numbers that look impressive but don't directly drive business outcomes. For example, page views or social media follower counts feel good when they increase but don't necessarily translate to leads or revenue. The fix: for every KPI, test whether you can explain how improving it would impact the KGI. If you can't explain the link, it's not a suitable KPI.
Business environments and marketing strategies evolve. Running year-start KPIs unchanged for 12 months creates a gap with reality. The fix: review KPI validity quarterly and update metrics and targets as needed. Since KPI changes risk being perceived as "moving the goalposts," document the reasoning and context for every change.
When marketing and sales KPIs aren't aligned, you get the classic conflict: "Marketing says they delivered leads; Sales says the lead quality is poor." The fix: align on MQL definitions and lead handoff criteria between marketing and sales, and establish shared KPIs like pipeline contribution and win rate. Having both teams track KPIs on the same dashboard strengthens alignment.
When setting KPI targets, referencing industry benchmarks helps calibrate realistic levels. Here are benchmark guidelines for key metrics.
For email marketing, industry-average open rates are 20–25%, click-through rates 2–5%, and unsubscribe rates under 0.5%. For search advertising, search ad CTR benchmarks are 3–5% and CVR 2–5% (for B2B). Landing page CVRs average 2–5% for B2B and 1–3% for B2C. Webinar attendance rates are typically 40–60% of registrants, with opportunity conversion rates of 10–20% of attendees.
However, benchmarks are reference points only and vary significantly by industry, product, and target audience. The proper approach is to use your own historical performance as a baseline while recognizing gaps versus benchmarks as opportunities or areas for improvement.
Marketing KPIs don't work when you simply list metrics. They function only when you follow the five-step process—reverse-engineering from business objectives (KGI), decomposing the funnel, building the KPI tree, setting targets, and establishing a monitoring framework—and then operate a review-and-update cycle to continuously evaluate and improve marketing performance.
The initiative-specific and department-specific KPI lists in this article should be selectively incorporated into your KPI tree according to your marketing strategy. You don't need to implement everything at once. Start by establishing KPIs for the highest-impact initiatives and gradually expand coverage—this approach leads to sustainable improvement.
A clear explanation of what CAC (Customer Acquisition Cost) is. Covers the formula with worked examples, the types of CA...

Organizes the relationship between ROI and cost-effectiveness and explains how to calculate ROI with examples. Covers th...

From the basics of what a KPI is, this guide lists concrete examples by department (sales, marketing, customer support) ...