Published:
Last Updated:
Category: Marketing Glossary, Marketing Strategy
Authors: Shusaku Yosa
"We're successfully attracting customers through ads, yet for some reason it doesn't lead to final purchases or sign-ups." "I can only sense, rather than know, where on the site users are dropping off." Funnel analysis is what unravels these concerns with numbers. Funnel analysis is an analytical method that divides the process by which users move from awareness to purchase (conversion) into multiple stages, visualizes the pass-through rate and drop-off rate at each stage, and identifies where there is room for improvement.
This article systematically explains, from the meaning of funnel analysis and the basics of the funnel concept, to concrete calculation methods you can do even in Excel, representative funnel models, applicable situations, and points to note. Furthermore, it goes a step further into something many explanatory articles do not touch on: how to carry out effect measurement that a team can continuously improve, so that you don't just "analyze once and be done." By the time you finish reading, you should be in a state where you can run funnel analysis on your own data starting tomorrow.
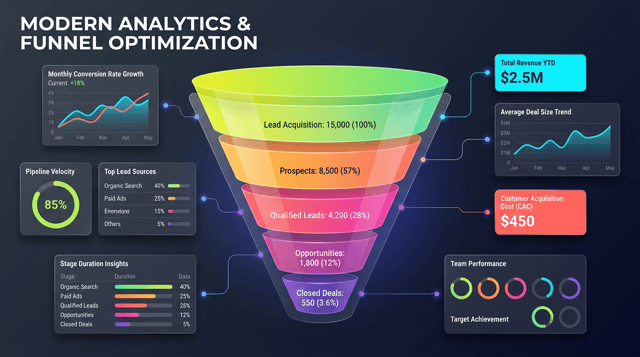
Funnel analysis is an analytical method that breaks down the series of processes by which users go from becoming aware of a product or service to making a purchase or contract into individual stages, and numerically grasps how many people reached each stage and how many advanced to (or dropped off before) the next stage. "Funnel" means a funnel (a cone-shaped tool). Even when there are many users at the entrance, the number is narrowed down as the stages progress, and only a portion reaches a purchase in the end—because this shape resembles a funnel, it is called this.
The purpose of funnel analysis is to identify, among the stages up to purchase, "where, and how many users, are dropping off," and to pinpoint the bottleneck that should be improved. Even if you only look at the overall conversion rate (CVR), you cannot tell why it is low. Only by dividing the process into stages do specific issues come into view, such as "there are many ad clicks, but a large drop-off on the product page" or "users advance up to adding to the cart, but half leave right before payment." The value of funnel analysis is that it can point to the levers for improvement with data, not gut feeling.
When you perform funnel analysis, the following mainly become visible.
Funnel analysis demonstrates its power in processes where "users pass through multiple stages in order toward a goal." Representative examples include the purchase path of an e-commerce site, the inquiry and negotiation process of B2B, the registration and retention flow of an app, and the path from free registration to paid conversion of a subscription. On the other hand, when the boundaries between stages are vague, or when the central behavior is complex—with users not progressing in order but moving back and forth—a simple straight-line funnel may fail to capture the reality. In such cases, you need to combine the segment analysis described later or a view that considers multiple paths.
To understand funnel analysis, it helps to grasp the representative models of the "funnel (purchase process)" that serve as the foundation. How you divide the stages varies by purpose, but here we introduce commonly used ways of thinking.
The simplest and most widely used is the purchase funnel, which narrows down toward purchase. It is generally expressed in stages such as "awareness → interest → comparison/consideration → purchase." It is a model that pictures the very shape of a funnel, with more people at the top and fewer toward the bottom.
A classic model representing the consumer's psychological process is AIDMA (Attention, Interest, Desire, Memory, Action). After the spread of the internet, AISAS (Attention, Interest, Search, Action, Share), which incorporates Search and Share, was proposed. Strictly speaking, these are not funnels themselves, but they serve as the foundation when considering how to design the stages of a funnel.
The way of thinking that captures things not as ending at purchase but including subsequent "retention, recommendation, and diffusion" is the double funnel. It has an hourglass-like shape, connecting the narrowing-down funnel up to purchase (the purchase funnel) with a reverse funnel (the influence funnel) in which, after purchase, fans generate new awareness through word of mouth and sharing. In modern marketing, which emphasizes LTV and repeat business, a design that takes the post-purchase phase into view has become important.
Whichever model you use, what matters is designing the stages to match "the path your users actually follow." Rather than applying textbook stages as-is, it is practical to map them to behaviors you can actually measure (ad clicks, page views, cart additions, payment completions, etc.).
Funnel analysis can be carried out in Excel or a spreadsheet as long as you can obtain the number of people at each stage. Here, using the purchase path of an e-commerce site as an example, we explain the basic procedure in five steps.
First, decide "which process" to analyze and "into which stages" to divide it. For an e-commerce site, for example, line up the behaviors users actually follow in order, such as "site visit → product page view → add to cart → start checkout → purchase complete." If you make the stages too granular, the analysis becomes cumbersome; if too coarse, you cannot identify the bottleneck. The trick is to divide at a granularity where you can consider improvement levers separately.
Tally how many people (how many sessions) reached each defined stage. Obtain the figures from an access analysis tool such as Google Analytics (GA4) or from your own database. For example, line up the number of people per stage in a form like "site visit 10,000 → product page view 4,000 → add to cart 800 → start checkout 400 → purchase complete 200."
Next, calculate how much advanced from each stage to the next (transition rate) and how much left (drop-off rate). The formulas are simple.
For example, if 4,000 people who viewed the product page advanced to 800 who added to cart, the transition rate is 20% and the drop-off rate is 80%. By calculating the transition rate of each stage in order, where the number of people is dropping greatly becomes visible in numbers.
Visualize the calculated number of people and transition rates with a funnel chart (a diagram that narrows in width by stage) or a bar graph. When you visualize, it becomes clear at a glance at which stage the number of people drops sharply—that is, the bottleneck. It can be sufficiently expressed even with an Excel horizontal bar graph, and by noting the transition-rate figures alongside, it becomes easier to share a common understanding within the team that "this is the biggest issue."
Once the bottleneck is visible in the overall funnel, further break it down by segment (traffic source, device, new/repeat, etc.). For example, if you find that "the drop-off from cart addition to purchase is especially large on smartphones," the possibility comes into view that there is a problem with the smartphone payment screen. With the overall figures alone, you end up with a vague "there's somehow a lot of drop-off," but by slicing by segment, the specific target to improve becomes clear.
To deepen understanding, let us trace the flow of calculation using the purchase path of an e-commerce site as an example. Suppose the number of people at each stage in a given month was as follows.
In this example, the overall CVR is 200 ÷ 10,000 = 2%. Looking at the transition rate of each stage, you can see that the biggest drop is "product page view → add to cart" at 20% (drop-off 80%). In other words, 80% of users who viewed the product page leave without adding it to the cart, and this is the biggest bottleneck.
In this case, the stage with the biggest improvement impact is the product page. By reviewing how product information is presented, the display of price and reviews, the clarity of the cart button, and so on, there is room to improve the transition rate here. If you can raise the transition rate from 20% to 25%, the number of people at the subsequent stages will increase in tandem, leading to a boost in the overall CVR. The strength of funnel analysis is being able to judge with numbers which stage, when worked on, will have the biggest effect on the whole.
Funnel analysis can be applied to a variety of businesses by changing the stage design. Here we introduce representative use scenarios.
Divide the path from visit to purchase completion into stages and improve the stages with large drop-off. If the drop-off on the product page is large, review the content and UI; if the drop-off after the cart is large, review the shipping-fee display, payment methods, the cumbersomeness of the input form, and so on. Form improvement (EFO) is a representative lever for reducing drop-off right before purchase.
In B2B, you capture the sales process such as "lead generation → conversion to opportunity → proposal → closing" as a funnel. By visualizing at which stage deals are stalling, you can separate out whether the issue lies with marketing or with sales. You can make judgments such as: if there are many leads but the opportunity-conversion rate is low, the issue is the quality of leads or the initial response; if opportunities are created but the win rate is low, the issue is the proposal content or closing.
For apps and subscriptions, you make a funnel of stages such as "install → sign-up → first use → continued use → paid conversion." You focus on the stages directly tied to business growth, such as drop-off right after registration (an onboarding issue) and the conversion rate from free to paid. By combining this with retention rate and LTV, it becomes easier to judge which stage's improvement is effective for revenue.
Funnel analysis is simple and powerful, but used incorrectly it can lead to mistaken judgments. Let us cover the points to be careful about in practice.
In particular, the last point—"do not stop at analysis"—is the biggest reason that funnel analysis becomes a mere formality at many sites. In the next chapter, we explain how to carry it forward into continuous results.
The true value of funnel analysis is demonstrated not by a single visualization but by continuously turning the cycle of "analysis → measure → effect measurement → re-analysis." Here we explain the practical procedure for establishing the operation as a team and continuously improving results.
For the bottleneck identified in the analysis, decide "what to do" and "who does it" as a set. The principle is to tackle the stage with the largest drop-off first. As in: if the product page is the issue, assign content improvement to the production owner; if the drop-off right before payment is the issue, assign form improvement to the development owner—the point is to map each stage's issue to a lever and an owner and make it a shared understanding of the team.
Before applying a measure, decide in advance the KPI by which you will judge success. This is because if you set the metric after the fact, it tends to become a convenient interpretation. Representative KPI examples are as follows.
Funnel analysis is meaningful only when updated at a steady rhythm. Decide the update frequency to match your own speed of change—weekly to monthly for e-commerce where traffic and measures change quickly, monthly to quarterly for B2B with long negotiation cycles—and build it into regular meetings. By checking each time which stage's transition rate changed since last time, you can catch early the effect of improvements and signs of new issues.
To correctly measure the effect of a measure, it is effective to incorporate A/B testing to the extent possible. By comparing the transition rate of the target stage between the group shown the improvement plan and the group with the conventional version, you can objectively judge "whether that measure really worked." It becomes less susceptible to external factors such as seasonal factors and traffic changes, raising the precision of effect measurement. Even when testing is difficult, simply recording the implementation date of the measure and comparing the transition rate before and after can serve as material for judgment.
Record and share within the team the insights gained in each cycle of "to which stage, what measure was applied, and what the result was." Accumulating which measures worked and which did not raises the precision of the levers for the next bottleneck and can also be used to review the stage design. Building a state where anyone can run it at a consistent precision, preventing it from depending on specific individuals, is the destination of continuous improvement.
In this way, if you design the operation on the premise of effect measurement, funnel analysis evolves from "analysis that explains the current state" into "a mechanism that continuously improves results." Rather than creating a perfect funnel in one go, continuously turning the cycle without stopping is what directly leads to long-term results.
Funnel analysis is a method that divides the process from awareness to purchase into stages, visualizes the transition rate and drop-off rate of each stage, and identifies the bottleneck that should be improved. The calculation can be done in Excel: from the number of people at each stage, you find the transition rate, drop-off rate, and overall CVR, visualize it with a funnel chart, and dig deeper by segment—all in five steps. Its range of application is broad, including e-commerce, B2B, and apps, and if you keep in mind points such as matching the stage design to reality and not over-assuming straight-line behavior, it becomes a powerful weapon for decision-making.
And the most important thing is not to stop at analysis. By deciding the measures and owners for the bottleneck, measuring the effect with KPIs, reviewing the changes in transition rate in a regular cycle, verifying with A/B testing, and putting the knowledge to use next—continuously turning this loop as a team makes funnel analysis a mechanism for continuous results improvement. First, try making your main path into a funnel and visualizing it once, and start by finding the biggest bottleneck.

A clear explanation of what viral means: the mechanism by which information spreads chain-like through word of mouth and...
A clear explanation of what an NPS score is. Covers the promoter/passive/detractor classification and the "promoters − d...
What is the CCPA (California Consumer Privacy Act)? Covering who it applies to outside California, the six consumer righ...