What Is a Dimension? The Difference from a Metric and How to Use It in GA4
Published:
Last Updated:
Category: Web Analytics
Authors: Shusaku Yosa
Published:
Last Updated:
Category: Web Analytics
Authors: Shusaku Yosa

Once you start using GA4's reports and explorations, the words "dimension" and "metric" are sure to come up. While they are confusing until you get used to them, correctly understanding the difference between the two becomes the foundation for reading reports and reaching the data you want to know. This article clearly explains what a dimension is, how it differs from a metric, and concrete ways to use it in GA4.
A dimension is, in a word, the "angle" or "axis of analysis" for classifying data. It refers to the items for slicing numbers such as the number of users or page views by the angle you want to see, such as "by page," "by device," or "by region."
For example, with only the data "the site's total page views were 10,000," you can't tell which page is popular. By dividing the data with the dimension "by page," you can see the page views for each page. Analysis means dividing finely to examine, and a dimension plays exactly that role of "dividing" for that purpose.
GA4 has more than 150 dimensions available by default, letting you classify data by various angles such as page title and URL, the user's country, region, age, and gender, and the device used.
Appearing often as a set with a dimension is the "metric." The two are easily confused, but they can be organized simply by considering their roles separately.
The relationship of the two becomes clear at a glance when applied to the form "see △△ by ○○." What goes in ○○ is the dimension, and what goes in △△ is the metric. For example, in "see page views by page," "page" is the dimension and "page views" is the metric.
When in doubt, it becomes easier to judge by considering whether you can say "per ○○" or "by ○○," and whether a sum or average has meaning. The number of sessions has meaning as a sum so it's a metric, while the sum of male and female has no meaning so it's a dimension.
Dimensions can be used in both GA4's standard reports and exploration reports. Let's look at the basic operations of each.
Standard reports are convenient when you want to quickly grasp an overview of the data. For example, in the "Traffic acquisition" report, clicking the pull-down of the dimension name on the left of the table lets you switch to "Session source/medium," "Session campaign," and so on. This lets you check the same metric by different angles.
When you want to analyze more freely, use exploration reports. The steps are as follows.
Since you can create a table just by dragging and dropping, flexible analysis is possible even without specialized knowledge.
Dimensions can be used not just one at a time but in combination. For example, combining "gender" and "age" reveals a more concrete user image such as "how many male users in their 20s." In standard reports you can add a second angle as a "secondary dimension," and in explorations you can dig in from multiple angles in pivot-table form.
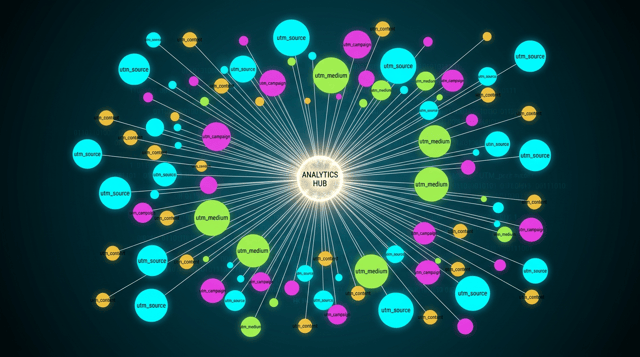
When the dimensions provided in advance in GA4 are not enough, you can create a "custom dimension" to add your own angle. It is useful when you want to analyze data by your company's own classification not in the standard, such as "registered user / unregistered user."
Custom dimensions are created based on the values of event parameters sent from the site or app. Note that parameters you set on your own will not appear in reports unless registered as custom dimensions in the GA4 admin screen.
GA4 also has dimensions whose actual meaning differs from the impression their name gives. Let's keep the typical ones in mind.
Rather than judging by the impression of the name alone, checking what each dimension actually represents before using it improves the accuracy of your analysis.
A dimension is the angle / axis of analysis for classifying data, referring to text items such as "page," "device," and "region." A metric, on the other hand, is a number such as "number of users" or "page views." Remembering that the ○○ in "see △△ by ○○" is the dimension and △△ is the metric makes it easier to organize. In GA4 you can use dimensions through switching in standard reports and combining in exploration reports, and using custom dimensions lets you analyze by your own angles too. Start by using familiar dimensions, and grasp the feel of reading data from multiple angles.
A URL parameter is a variable added to the end of a URL. This article explains, for beginners, the two types (active and...

Explains how to log in to Google Analytics (GA4) in two ways—directly from the official site and via Google Ads. Also co...

A referral is a channel indicating traffic that arrives via a link on another website. This article explains its meaning...