What Is ROAS? Calculation, ROI Comparison & Benchmarks for Ad Managers
Published:
Last Updated:
Category:
Published:
Last Updated:
Category:
Authors: Shusaku Yosa
"I'm spending on ads, but I can't tell if they're actually working." For ad managers facing this challenge, ROAS is the first metric to master. Understanding ROAS correctly lets you judge which ads contribute to revenue by the numbers, directly informing smarter budget allocation.
This article covers everything systematically: the definition and formula of ROAS, how it differs from ROI and CPA, industry benchmarks, how to calculate break-even ROAS, and concrete strategies to improve it.
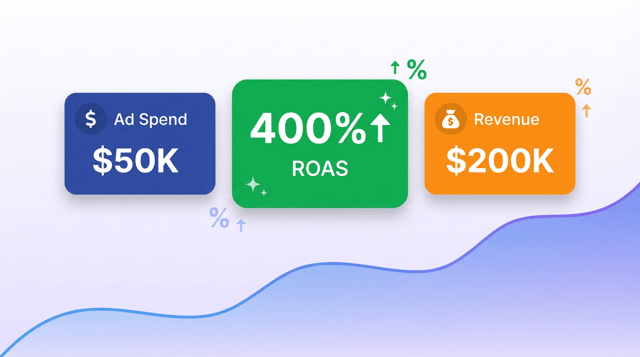
ROAS (Return On Advertising Spend) is a metric that shows how much revenue was generated for every dollar spent on advertising. It visualizes revenue per ad dollar, making it extremely useful for comparing performance across multiple campaigns side by side.
For example, a ROAS of 300% means every $1 in ad spend generated $3 in revenue. A ROAS of 100% means ad spend and revenue are equal (break-even), while anything below 100% means ad costs aren't being recouped through sales.
However, ROAS is a revenue-based metric, so it doesn't account for costs like product COGS or labor. Even with a ROAS above 100%, you could still be operating at a loss once you factor in costs—an important caveat to keep in mind.
The ROAS formula is straightforward:
ROAS (%) = Revenue from Ads ÷ Ad Spend × 100
A critical point here: use "revenue from ads," not total business revenue. The definition of ad-attributed revenue varies by company, but it typically refers to sales from customers who clicked on or viewed an ad before purchasing.
Example 1: $5,000 ad spend generates $25,000 in revenue
ROAS = $25,000 ÷ $5,000 × 100 = 500% ($5 in revenue per $1 of ad spend)
Example 2: $10,000 ad spend generates $6,000 in revenue
ROAS = $6,000 ÷ $10,000 × 100 = 60% (ad spend is not being recovered)
By comparing ROAS, you can instantly see which ads deserve more budget.
In ad performance measurement, ROI and CPA are also frequently used alongside ROAS. Each evaluates ads from a different angle, so understanding their differences and using them together is essential.
Formula: Ad Revenue ÷ Ad Spend × 100. Evaluates ad effectiveness on a revenue basis. Best suited for comparing multiple ads with different product price points.
Formula: Profit (Revenue − COGS − Investment) ÷ Total Investment × 100. Evaluates investment efficiency on a profit basis. While ROAS only looks at revenue, ROI captures the final profitability including COGS and other costs. ROI is better suited for overall business decision-making.
For example, with $3,000 in ad spend plus $2,000 in other costs (total $5,000), generating $12,000 in revenue with $6,000 in COGS, the ROAS is 400% but the ROI is only ($1,000 ÷ $5,000 × 100 =) 20%. A campaign that looks great by ROAS may reveal modest investment efficiency under ROI.
Formula: Ad Spend ÷ Conversions. Shows the cost to acquire one conversion. CPA is more intuitive for B2B lead generation where each outcome has a uniform value. For e-commerce with varying product prices, ROAS provides a more accurate assessment.
These three metrics aren't meant to stand alone. Use ROAS to check revenue contribution, ROI to validate profitability, and CPA to monitor acquisition efficiency. This multi-metric approach enables a well-rounded ad evaluation.
"What ROAS percentage is considered good?" varies significantly by business model and industry. There's no universal answer, but industry benchmarks provide a useful reference when setting your own targets.
As a general trend, B2C consumer goods and e-commerce tend to achieve higher ROAS because the path to purchase is shorter and impulse buying is more common. In contrast, B2B and SaaS typically show lower initial ROAS due to longer sales cycles. For subscription models like SaaS, evaluation based on LTV (Lifetime Value) is expected, so a low initial ROAS may be strategically acceptable.
External industry data is valuable as a starting point for determining evaluation criteria. However, the most important benchmark isn't competitors—it's your own break-even ROAS.
Break-even ROAS indicates the minimum ROAS needed to avoid losses on ad spend. It forms the foundation for setting your target ROAS.
Break-Even ROAS (%) = 1 ÷ Gross Margin × 100
For example, with a 50% gross margin, the break-even ROAS is 1 ÷ 0.5 × 100 = 200%. If ROAS falls below 200%, ad costs exceed gross profit and you're losing money. Set this figure as your floor and add a margin on top when determining your actual ROAS target.
ROAS isn't a universal metric—it works best for certain business models: e-commerce where purchases complete online, businesses offering multiple products or plans at different price points, stores where customers frequently buy multiple items, and businesses with frequent price fluctuations from campaigns and sales.
Conversely, for B2B lead generation where each conversion has a uniform value, or for brick-and-mortar businesses where purchases complete offline, CPA or other metrics that account for offline conversions are more appropriate.
The biggest advantage of ROAS is its ability to quantify how much each ad contributes to revenue. It makes it easy to run PDCA cycles—increasing budget for high-ROAS ads and applying fixes to low-ROAS ones. The simple formula and ability to calculate quickly from historical sales data also make it practical for day-to-day operations.
On the other hand, since ROAS is revenue-based, it can't tell you whether you're actually profitable. High ROAS on products with high COGS can still mean a loss. It's also unsuitable for evaluating branding campaigns that don't directly drive sales. Combining ROAS with indirect metrics like lead count and conversion rate gives a more accurate picture of ad performance.
Improving ROAS requires stacking improvements across every phase of ad operations. Here are five key approaches.
Delivering ads to high-intent users is the most direct way to boost ROAS. Deepen your audience data analysis and use lookalike audiences and retargeting to concentrate delivery on segments most likely to convert.
CTR and CVR are heavily influenced by creative quality. Continuously A/B test multiple variations with different value propositions to identify winning patterns.
Even with clicks, if users bounce on the landing page, it won't drive revenue. Review page load speed, above-the-fold messaging, and form friction to boost CVR, which in turn improves ROAS.
Leverage Google Ads' Target ROAS bidding or Meta's ROAS optimization to let AI automatically adjust bids. AI learns signals that manual management can't capture, distributing budget efficiently—especially effective at scale.
Since ROAS = Revenue ÷ Ad Spend, increasing the numerator (revenue) is also effective. Implement upsell and cross-sell funnels and CRM strategies that drive repeat purchases. If you can increase revenue per ad-acquired customer, ROAS improves even with the same ad spend.
There are several commonly overlooked points when using ROAS in practice.
First, align internally on the definition of "ad-attributed revenue." Whether you count only last-click or include view-through conversions significantly changes the numbers.
Second, don't judge on short-term ROAS alone. Especially with SaaS and subscription models, initial purchase ROAS may be low, but LTV-based assessment may show strong investment efficiency. Set appropriate evaluation windows.
Finally, always remember that high ROAS doesn't necessarily mean profit. ROAS is purely a revenue metric. Without comparing against break-even ROAS, you risk a situation where things look great on the surface while actually running in the red.
ROAS is the most fundamental metric in advertising, measuring revenue against ad spend. With the simple formula "Revenue ÷ Ad Spend × 100," it enables campaign performance comparisons and budget allocation decisions.
However, relying on ROAS alone to judge ad success is risky. Validate profitability with ROI and check acquisition efficiency with CPA—a multi-metric evaluation approach elevates ad management precision.
Start by calculating your break-even ROAS and identifying the gap with your current performance. Then combine the five improvement strategies—targeting, creatives, landing pages, bidding, and LTV—to steadily improve your advertising ROI.

A clear explanation of usability examples through good UI vs. bad UI. Covers concrete examples and improvements for inpu...

A clear explanation of the steps for designing and reviewing an onboarding process. Covers the basic stages, the design ...

A clear explanation of the meaning of "loyalty" in business. Covers the difference between loyalty (faithfulness) and ro...